Query Execution
These features are collected and stored at a 1 minute interval, with the exception of query snapshots. Query snapshots are collected and stored at 1 second intervals.
| Feature | Description |
|---|---|
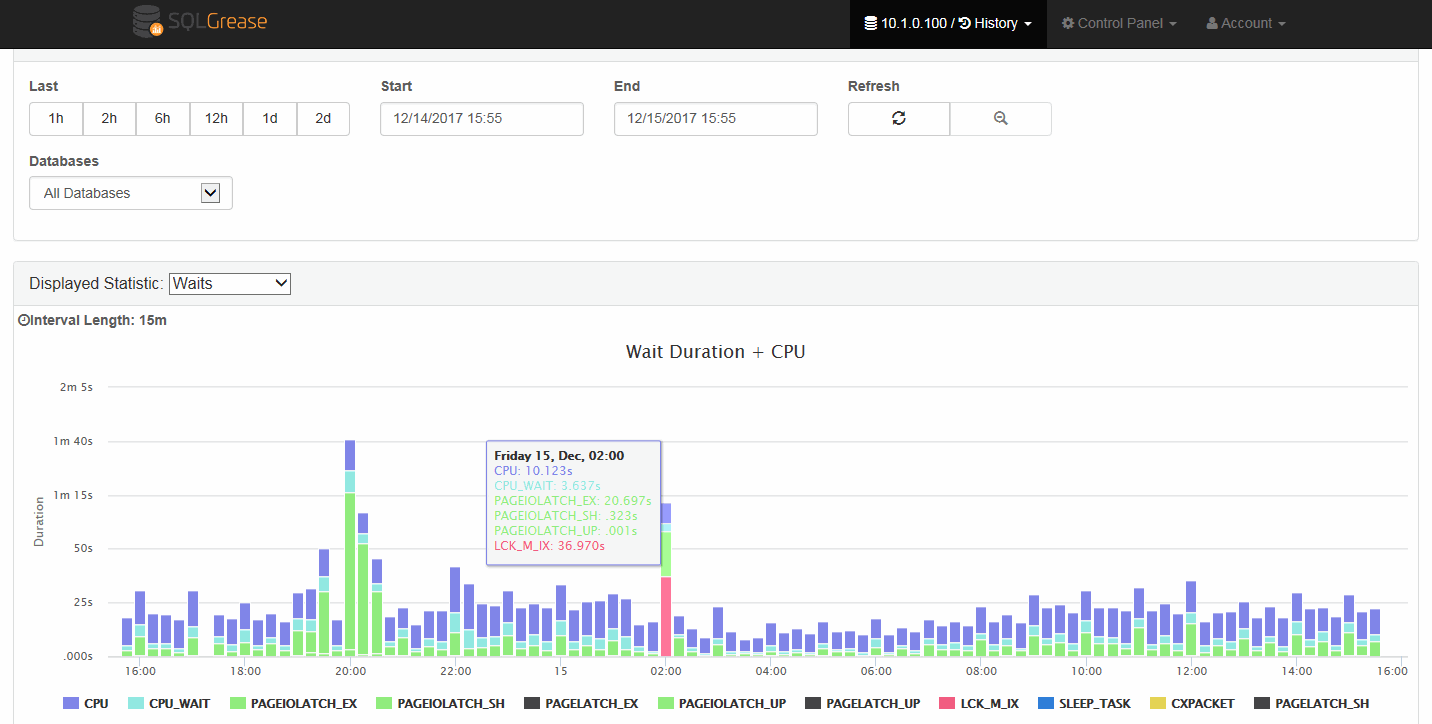
| Wait Event Analysis |
View query level wait events for any query. This is not to be confused with instance level wait events.
Most competitors can report instance level wait events, very few can report query level wait events.
Screenshot |
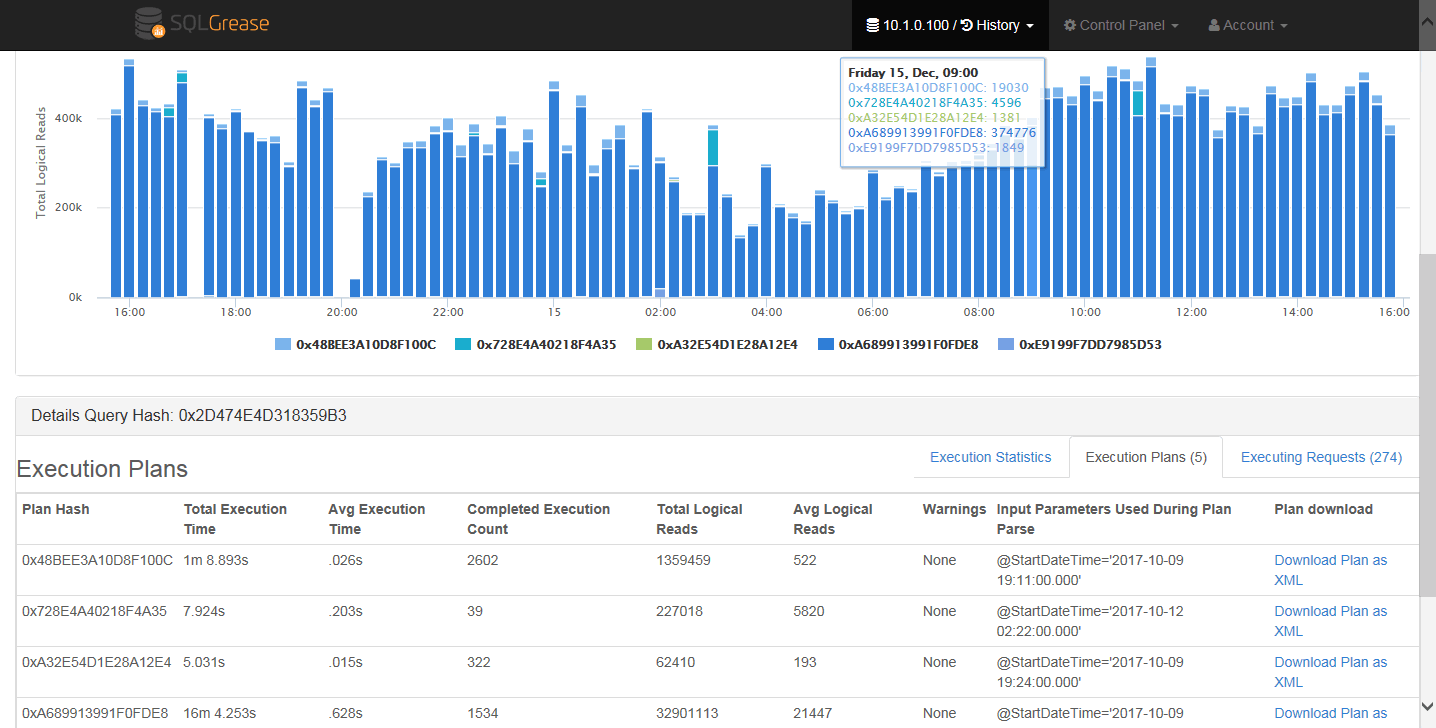
| Execution Plans | View all execution plans for any query. Execution plans are tracked historically
to help diagnose execution plan related performance issues. Response time, CPU time, and IO statistics
are tracked per execution plan. Execution plans are read from the plan cache so they are an
accurate representation of the plan. Plans are available for download so they
can be opened in SSMS.
Screenshot |
| Execution Plan Profiles (Live query plans) |
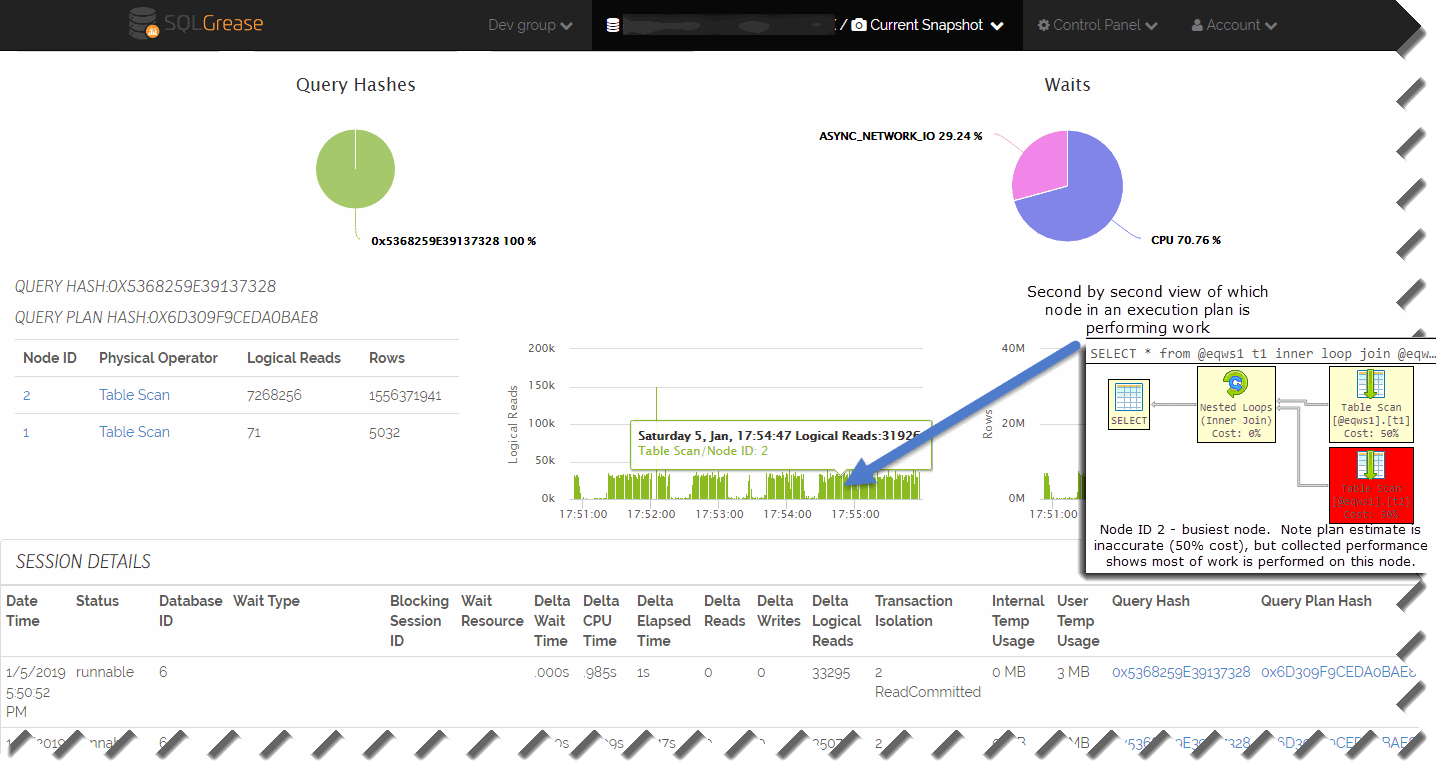
View which node in an execution plan is performing work at any given point in time. This is tracked historically
at a 1 second interval for any session that executes longer than a second. This feature helps you see hotspots in
an execution plan. This feature is only available in SQL Server 2016 SP1 and later. You must enable trace flag 7412
for this feature to activate.
Screenshot |
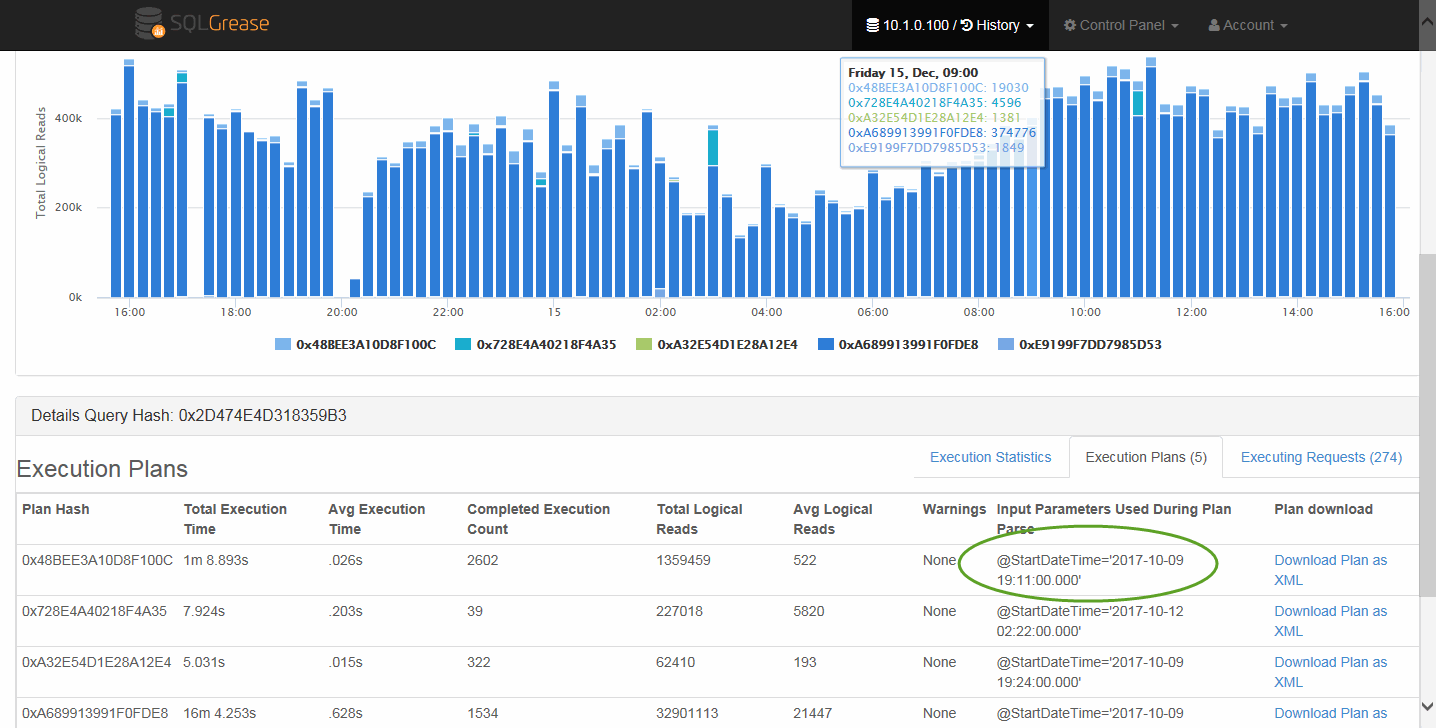
| Execution Plan Compile Parameters | View parameters that were used in compiling an execution plan. This is helpful for
diagnosing parameter sniffing issues.
Screenshot |
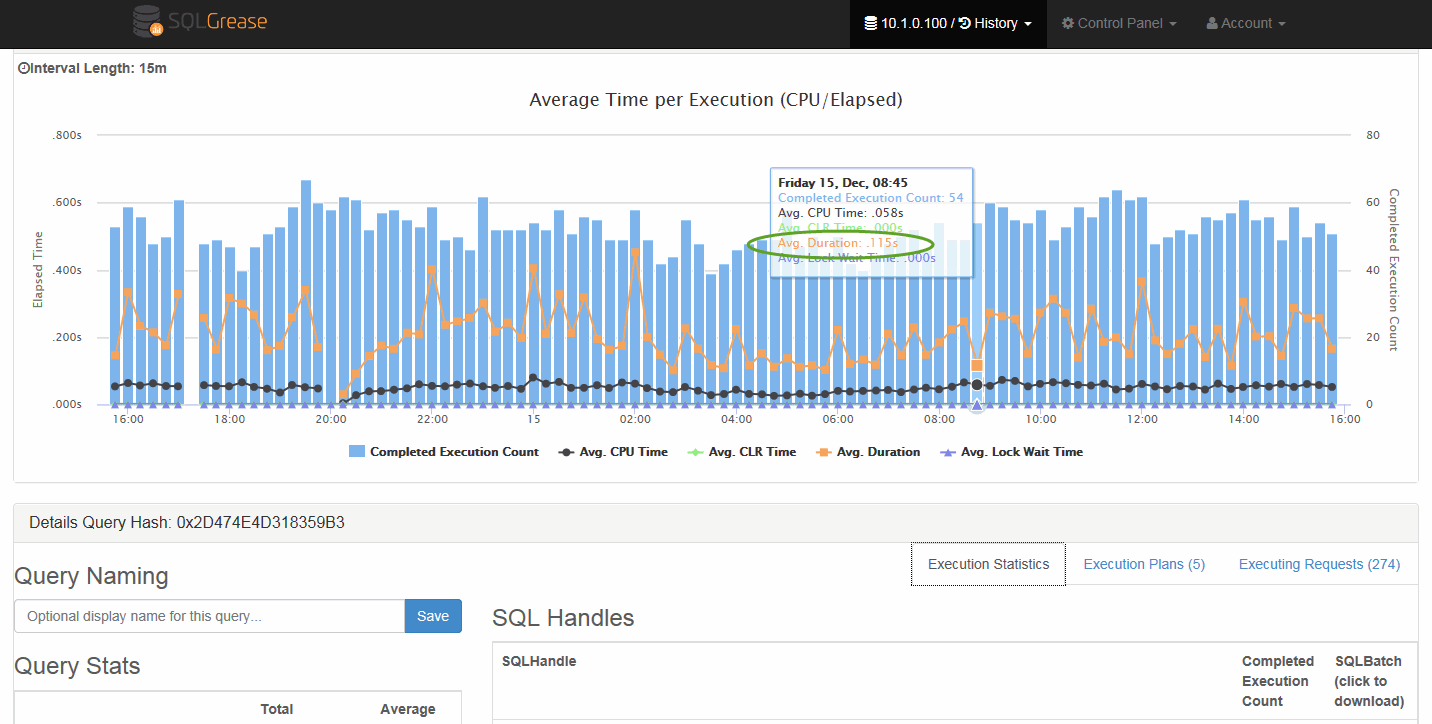
| Query Response Times |
View average and total query response times for any query.
Screenshot |
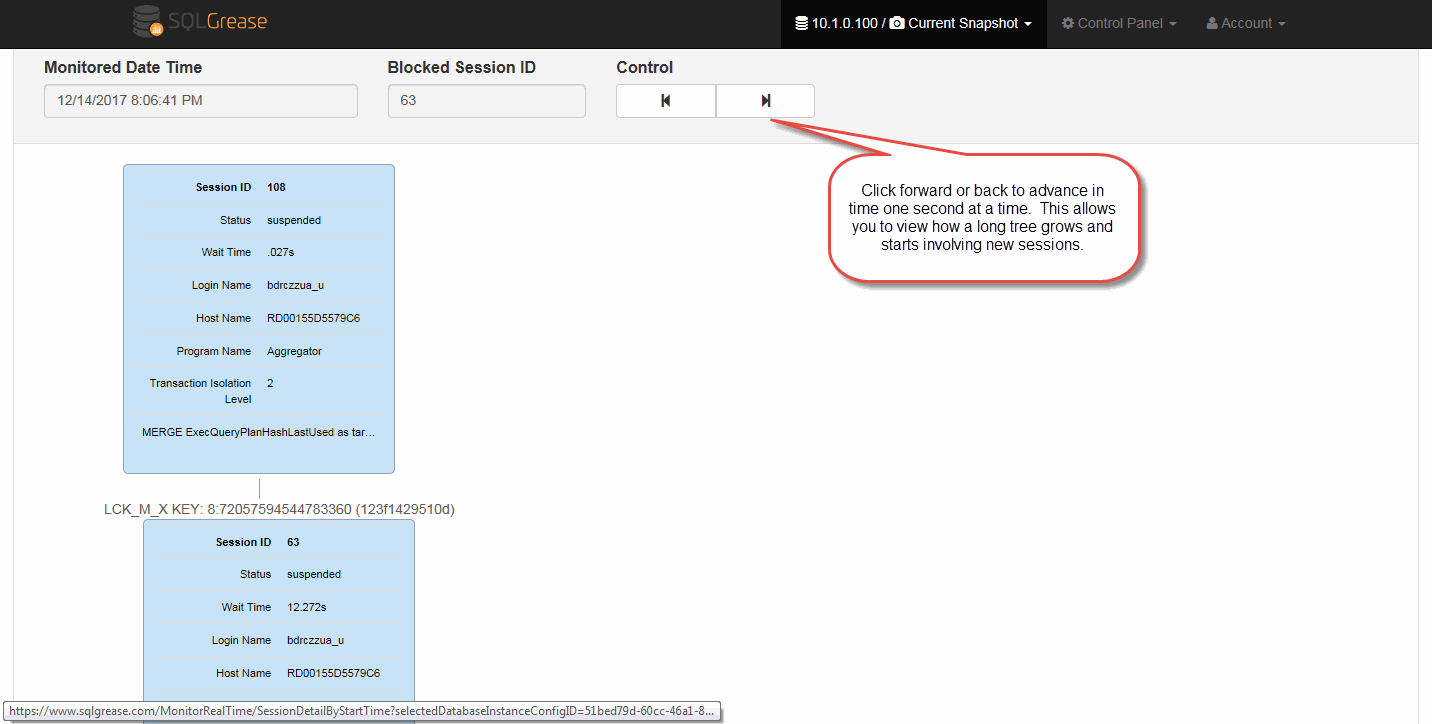
| Query Lock Tree Analysis |
View lock trees on any locks detected and view what the root blocker
was doing at the time of the lock. Lock trees are stored historically
so the information is available for viewing even if the problem
occurred in the past.
Screenshot |
| Query Deadlock Analysis | Capture deadlocks and group similar deadlocks together. View lock analysis
on sessions involved in deadlocks to find root cause. Deadlocks are stored
in xdl format and can be downloaded to open in SSMS. This feature additionally
fixes the invalid formatted XML bug that exists in SQL Server 2008.
|
| Query Memory Analysis | See what queries are responsible for consuming the most memory. This feature is valuable when diagnosing
RESOURCE_SEMAPORE waits.
|
| Query Temp DB Usage | See what queries are contributing most to tempdb usage. This shows what queries and what sessions cause tempdb growth.
This feature is useful for diagnosing unexpected fills of tempdb.
|
| Query Store Integration | View which SQLGrease collected execution plans map to query store. This feature will also generate query store commands
for forcing/unforcing plans.
|
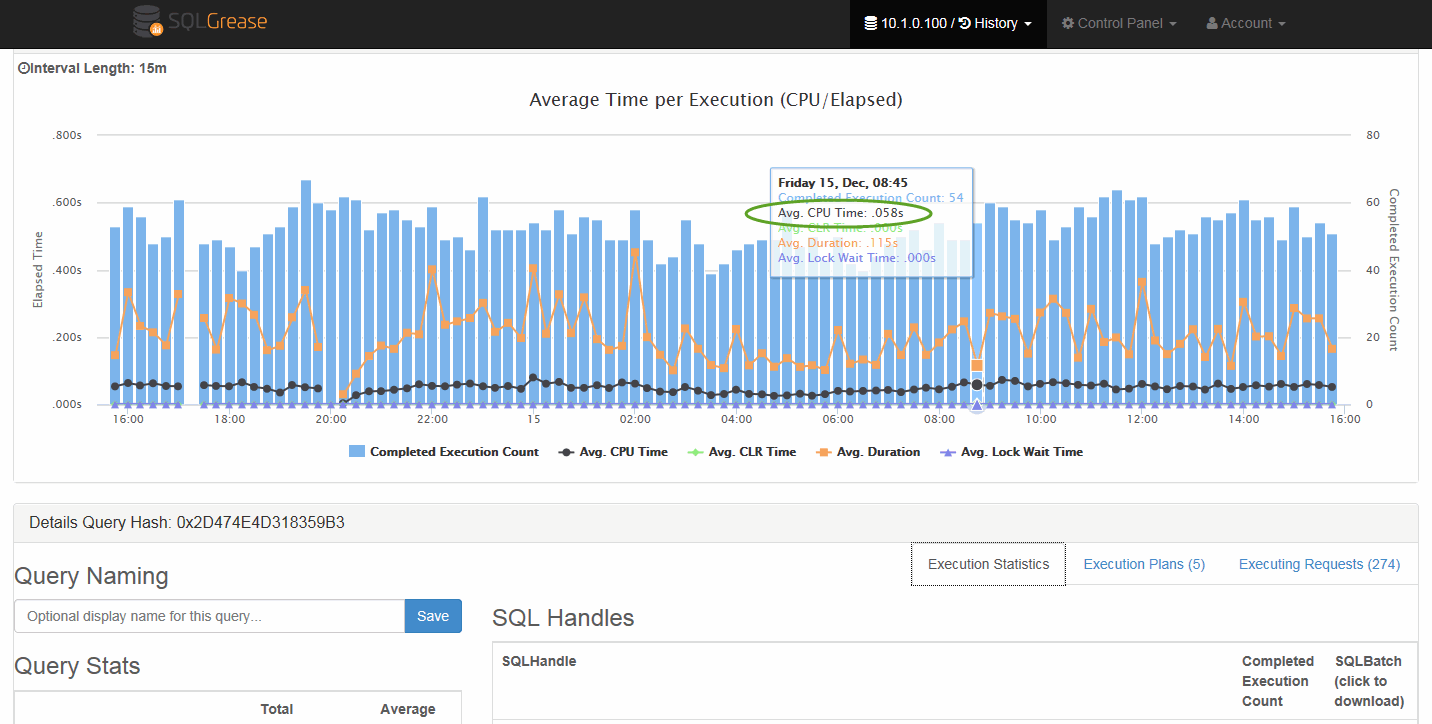
| Query CPU Time | View average and total cpu time for any query.
Screenshot |
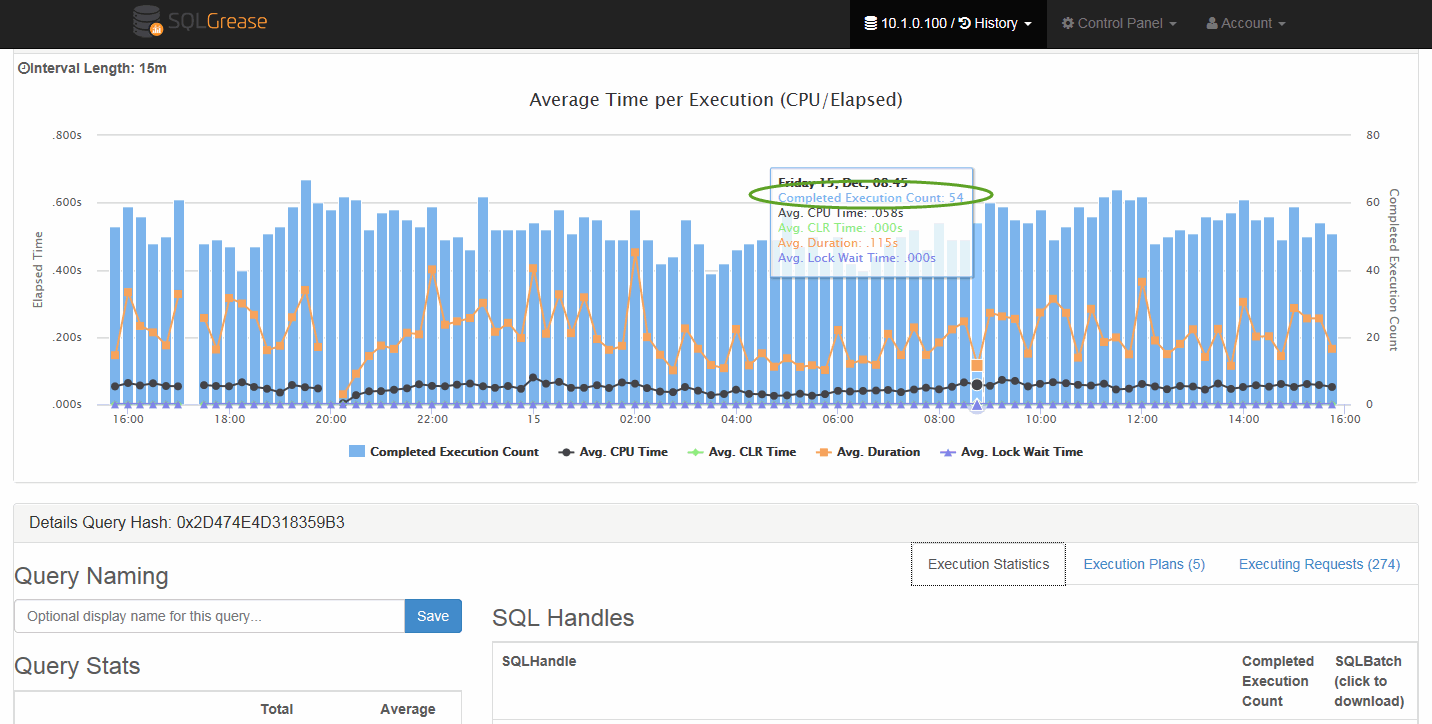
| Query Execution Counts | View query execution counts.
Screenshot |
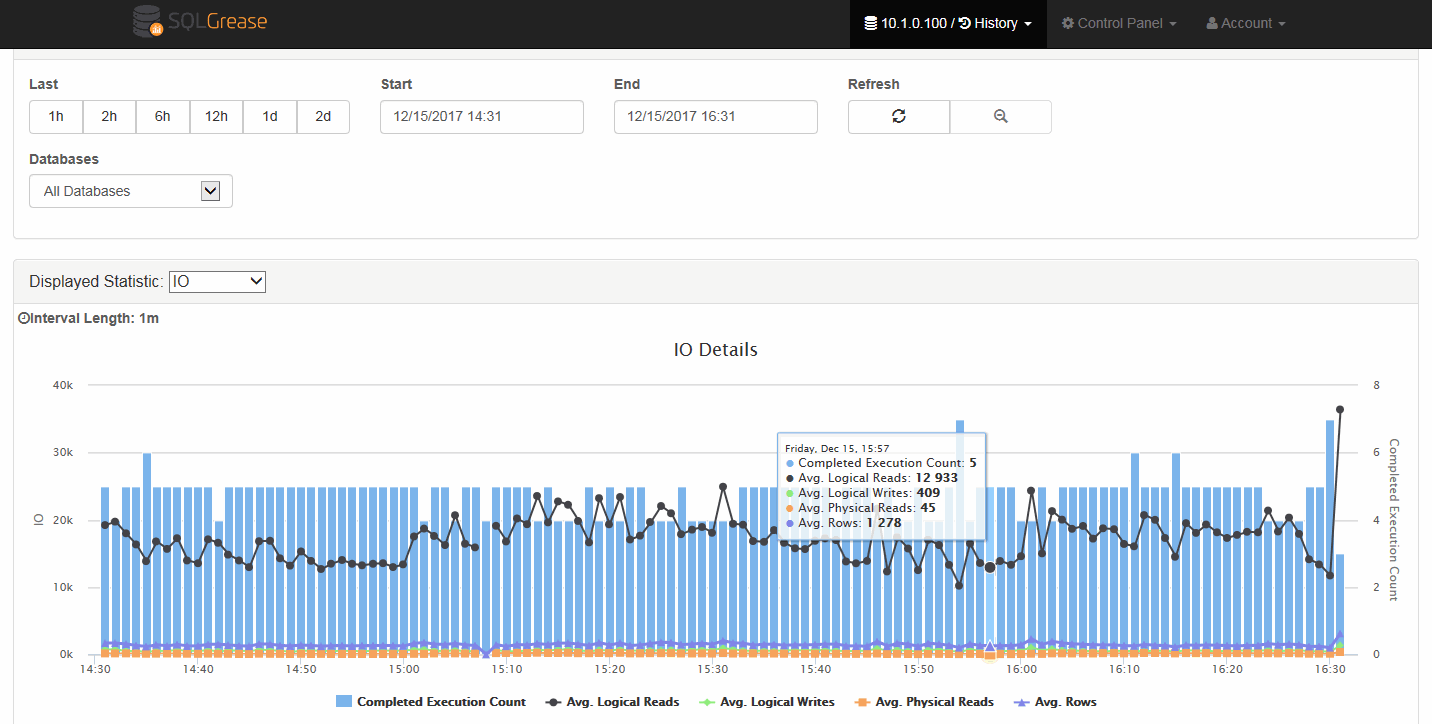
| Query IO | View logical reads, logical writes, and rows returned for any query.
Screenshot |
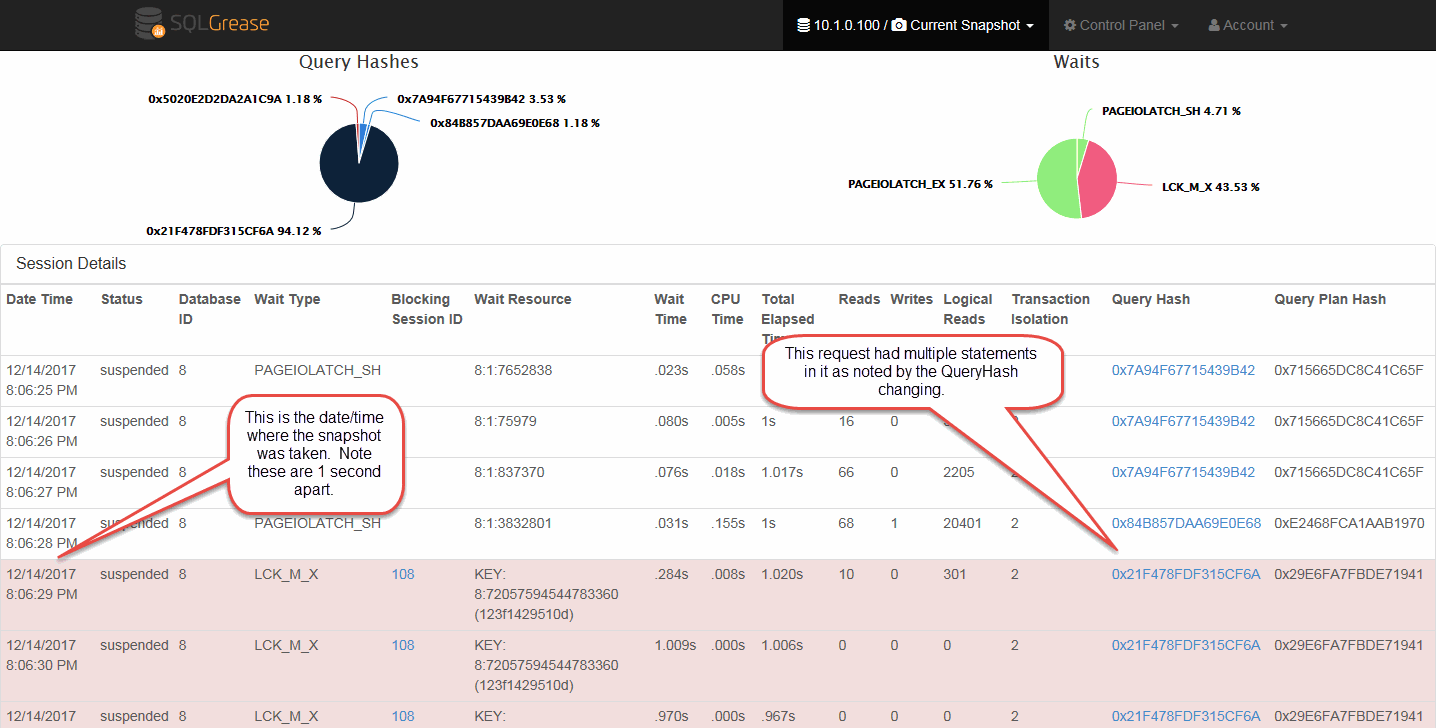
| Executing query snapshots | View a second by second snapshot of what a query was doing as it executed.
Executing query snapshots can be viewed live or historicaly.
Screenshot |
Security
| Feature | Description |
|---|---|
| Query Sanitization | Option for masking parameters in non parameterized SQL. This prevents any hardcoded values in a query from ever leaving the safety of your datacenter/network. |
| Execution Plan Sanitization | Option for masking parameters in execution plans. Execution plans may contain non parameterized SQL. They may also contain parameters used during the compilation of a query. This prevents any hardcoded values in a query or parameters used during compliation from ever leaving the safety of your datacenter/network. |
| SSL Communication | Our monitoring agent uses https to communicate with SQLGrease cloud services. Traffic is only outbound. No inbound firewall ports are required to your datacenter/network. |
| Minimum Access Required | View Server State access will provide access to all of SQLGrease's features except for OS performance counter monitoring. SQL Server performance counters are still available though. OS performance counter monitoring requires sysadmin permission on the instance. |
Events and Notifications
Events and notifications are processed and stored at a 1 minute interval.
| Feature | Description |
|---|---|
| Customizable Events |
Create events for a large variety of situations. Some examples:
|
| Filterable Events | Filter events based on a wide variety of options. Just a few examples:
|
| Customizable Notifications | Create notifications based on event occurences. Customizable rules prevents false positives. |
| Email based Notifications | Customizable subject line. Description of events causing notifications are included in body. |
Performance Counters
Performance Counters are collected and stored at a 1 minute interval.
| Feature | Description |
|---|---|
| OS Performance Counters | Processor, memory, and disk counters are collected. Not all counters are collected in order to reduce monitoring overhead and space usage. Providing too many counters can cause confusion when trying to determine an OS related problem. OS performance counters can only be collected if sysadmin is granted to user. |
| SQL Performance Counters | A select set of SQL Performance counters are collected. Not all counters are collected in order to reduce space usage. Providing too many counters can cause confusion. Wait events are the best starting point for performance diagnosis. |
Cloud
| Feature | Description |
|---|---|
| Support for RDS and Azure SQL Database | SQLGrease supports RDS and Azure SQL Database. |
| DTU Estimator |
If you are considering migrating your IASS or on premise version of SQL Server to Azure SQL Database,
SQLGrease can help you estimate what your DTU requirements would be.
|
Deployment
| Feature | Description |
|---|---|
| Small Footprint | The Agent Collector Service has a small footprint in your datacenter/network. It is a windows service that collects and sanitizes data from your SQL Server instances. A single collector service can collect from multiple SQL Server instances. The collector can run on a server that is configured with as little as 1 GB memory and 1 processor. During our free trial period it can even be run from a user workstation with no impact to performance. |
| Automatic Upgrades | SQLGrease has new features added regularly. New features do not require reinstallations or any intervention from customers. Our collection engine allows deployment of new collection points as we improve our product. |
| Free Upgrades | We do not charge for new features. |
Flexible Licensing
| Feature | Description |
|---|---|
| Floating License | Licenses are floating. This is great for non production environments where monitoring is only required during certain development and testing tasks. This is also great for SQL Server consultants that need a monitoring platform they can move between clients. |
| Subscription Based | Our subscription based pricing allows temporary monitoring of SQL Server instances. |
| Simple Pricing |
Pricing is based upon the amount of data stored in a dedicated SQLGrease data warehouse.
Even our lowest pricing tiers can store large amounts of data. You can modify the amount
of history retained to keep your pricing within certain boundaries. History is maintained at
multiple granularies (1 second, 1 minute, 15 minute, 30 minute, 60 minute, 1 day).
Each granularity can be adjusted individually.
Pricing |
| Upgradeable Pricing | Start with a low pricing tier and upgrade later if it is not large enough. Upgrades can be made at anytime. |
