NEW RELIC PLUGIN - SQLGrease Events Dashboard
The Events Dashboard displays SQLGrease Events.
- Home
- New Relic Plugin
- SQLGrease Events Dashboard
SQLGrease Events Overview
SQLGrease has a highly configurable Event Engine. The SQLGrease Event Engine can be configured to generate events for a wide variety of conditions. Some examples of events are:
- Query execution timeout errors
- Long query executions
- Connectivity errors
- Long lock waits
- Tempdb contention
- Memory pressure
- Execution plan warnings
- etc...
These events can be configured to avoid false positives by applying rules for an event within SQLGrease. A rule consists of a Field, a Relational Operator, and a single value or a set of values to compare to. Some examples of Fields that can be used in rules are:
- Command Type (i.e. SELECT, INSERT, UPDATE, BACKUP, MERGE, DELETE, etc..)
- Database Name
- Time of Day
- Day of Week
- Granted Query Memory
- Program Name
- Login Name
- Host Name
- Query Hash
- Elapsed Time
- and more...
Some examples of relational operators are:
- = (equal)
- <> (not equal)
- Starts With
- Ends With
- In (allows a list of values)
- Not In (allows a lit of values)
- and more...
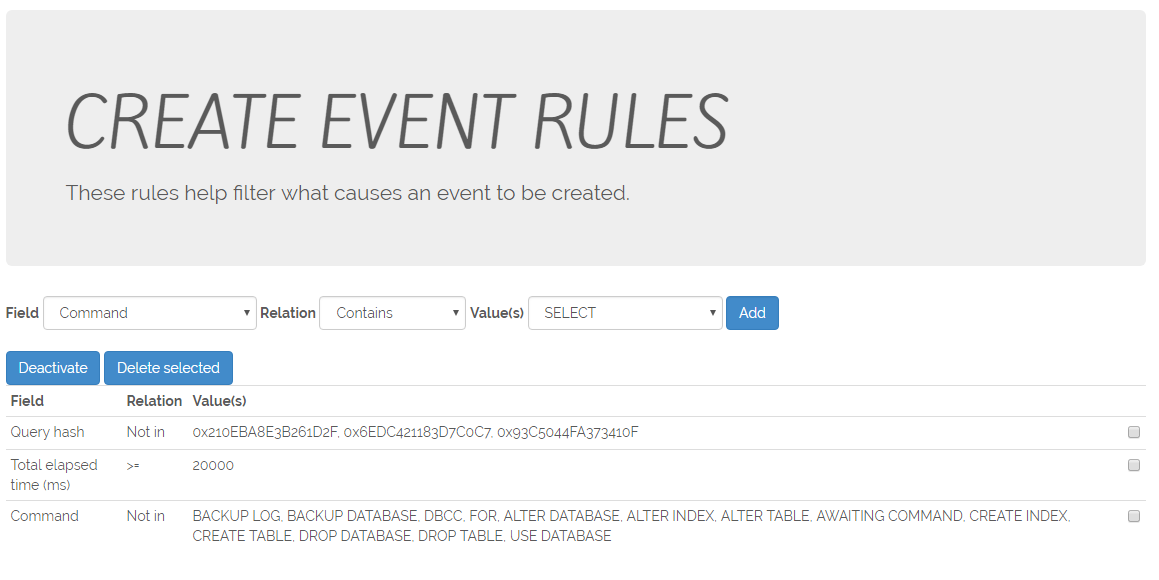
Below is an example of a rule for generating events for long executions (executions longer than 20,000 milliseconds) while filtering out things such as backups, index rebuilds, etc. The rule also filters out specific queries (as identified by the query hash).
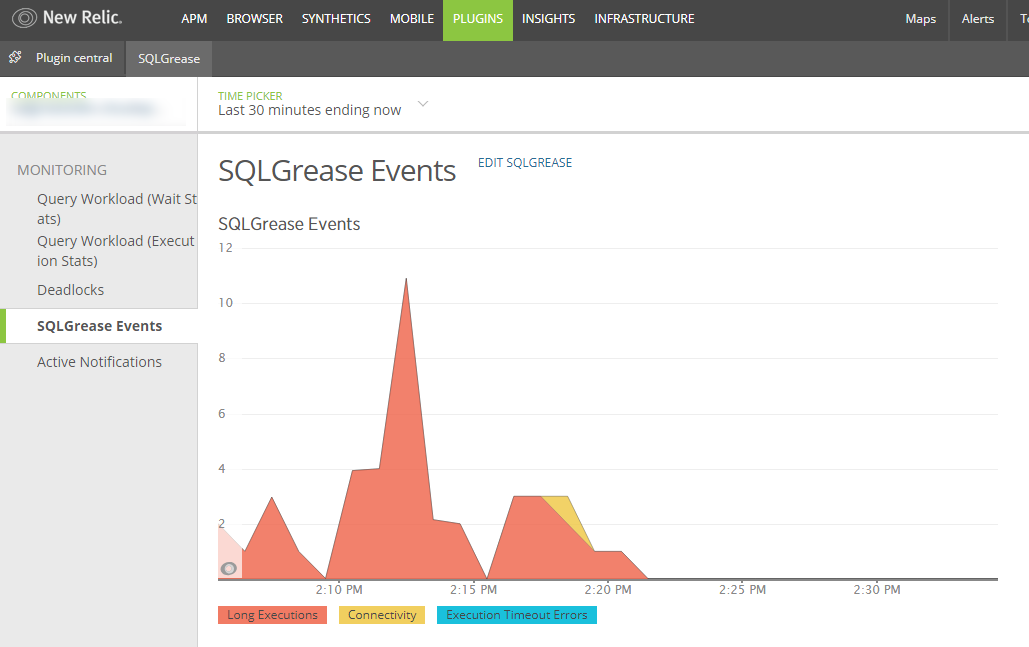
SQLGrease Events Dashboard For New Relic
The SQLGrease Events Dashboard lets you see when events are triggered within SQLGrease. This can be helpful in spotting clusters of things such as long executions, query timeouts, queries in long lock waits. These are all actionable items which are indicators to research details in the SQLGrease user interface.