
NEW RELIC PLUGIN
The SQLGrease New Relic Plugin is a Free plugin which provides visibility to data collected by SQLGrease. This plugin is free to both pay and free versions of SQLGrease.
- Home
- New Relic Plugin
Overview
SQLGrease measures query performance internal to SQL Server. From this perspective, SQLGrease is able to gain deep visibility into where stored procedures and queries are spending time. The plugin exposes this information through plugin dashboards and summary metrics.
Installation
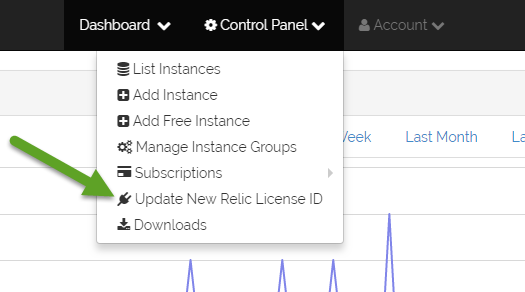
The SQLGrease New Relic Plugin requires no software installation. Simply enter your New Relic license ID and SQLGrease will
start sending performance data to New Relic. Either follow this link,
or while logged in to SQLGrease go to /Control Panel/Update New Relic License ID.
 .
.
Dashboards
The plugin comes with five dashboards:
- Query Workload (Waits)
- Query Workload (Elapsed Time)
- SQLGrease Events
- Active Notifications
- Deadlocks
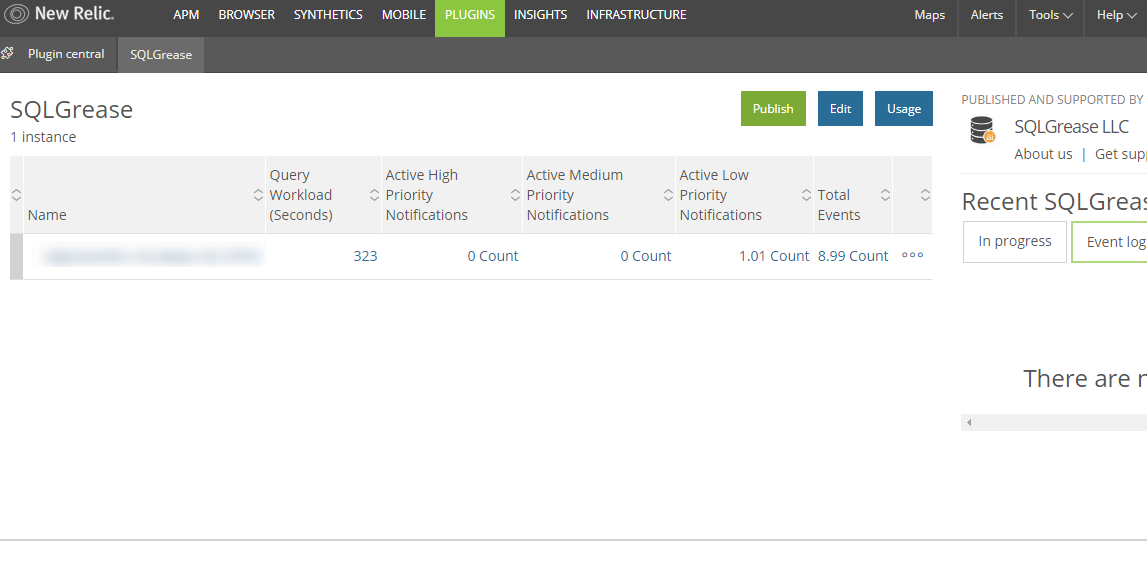
Summary Metrics
The plugin also comes with five summary metrics. The summary metrics are measured over the last 5 minutes of collected data.
- Query Workload
- High Severity Notifications
- Medium Severity Notifications
- Low Severity Notifications
- SQLGrease Events
Query Workload
Query workload is the average number of seconds over the past 5 minutes of total query time spent in the database.
Notifications
High, medium, and low severity notifications are the average number of active notifcations over the past 5 minutes.
SQLGrease Events
This is the total number of events over the last 5 minutes.